
Installing custom colormap in windy.com
Introduction
Windy.com is a fantastic weather visualization website, but the default colormap for wind speed can be misleading as it is not perceptually uniform (color and light contrasts distort the data), see the brilliant video about the design of better colormaps. However, Windy.com allows us to specify custom colormaps for any variable! This post will detail how to get the famous viridis colormap into windy.com.
Requirements
- A computer able to run
pythonwithnumpyandmatplotlib - A colormap you like
Windy.com requires a file.txt that maps a wind speed (or any other variable is SI units) onto an RGBA color. RGBA colors are defined by a list of integers (called channels), ranging from 0 to 255, representing the portion of red, green, blue, and transparency (alpha) of the color. For the default wind colormap, this looks something like this
[[0,[98,113,183,255]],
[1,[57,97,159,255]],
[3,[74,148,169,255]],
[5,[77,141,123,255]],
[7,[83,165,83,255]],
[9,[53,159,53,255]],
[11,[167,157,81,255]],
[13,[159,127,58,255]],
[15,[161,108,92,255]],
[17,[129,58,78,255]],
[19,[175,80,136,255]],
[21,[117,74,147,255]],
[24,[109,97,163,255]],
[27,[68,105,141,255]],
[29,[92,144,152,255]],
[36,[125,68,165,255]],
[46,[231,215,215,256]],
[51,[219,212,135,256]],
[77,[205,202,112,256]],
[104,[128,128,128,255]]]
where the first entry of every data point is the wind speed in m/s, and the second list is the RGBA color code. To change this to your favorite colormap, you simply have to paste the custom colormap file in the box that contains these values at the bottom of the costomize color scale page. This can also be found under My Account, Settings, customize color scale and wind.
Generating the custom colormap
To generate the custom colormap, we will need python3 and the two most common (perhaps) libraries, which can be imported in this way
import numpy as np
import matplotlib as mpl
which allows access to the colormap functionality. Next, we must define the wind speed we want to sample the colormap at. Here I have decided that I am interested in the range 0-30 knots (1 knot = 0.5144 m/s), as it is what we commonly sail/kite in. This means that wind speed greater than 30 knots will not be mapped correctly on the color scale.
v = np.linspace(0,30,21)*0.5144
Now we can choose a colormap that we like, I choose viridis but there are plenty more to choose from, see here.
viridis = mpl.colormaps['viridis']
The next step is to sample the colormap at the wind speed values but on the interval [0,1]. Here I have chosen to have 21 samples, as windy will then interpolate; this is sufficient.
my_cmap = viridis(np.linspace(0,1,len(v)))
The last step is to generate a .txt. file with the correct formatting to paste it straight into windy. This requires a manual conversion from the RGBA from matplotlib (0-1) to the windy RGBA (0-255)
output = open("windy_viridis.txt","w")
output.write("[")
for i in range(len(v)):
    text = "[%.4f,[" % v[i]
    text += "%d,%d,%d,%d]],\n" % (my_cmap[i,0]*255,
                                  my_cmap[i,1]*255,
                                  my_cmap[i,2]*255,
                                  my_cmap[i,3]*255)
    if(i==len(v)-1): text = text[:-2]+"]"
    output.write(text)
output.close()
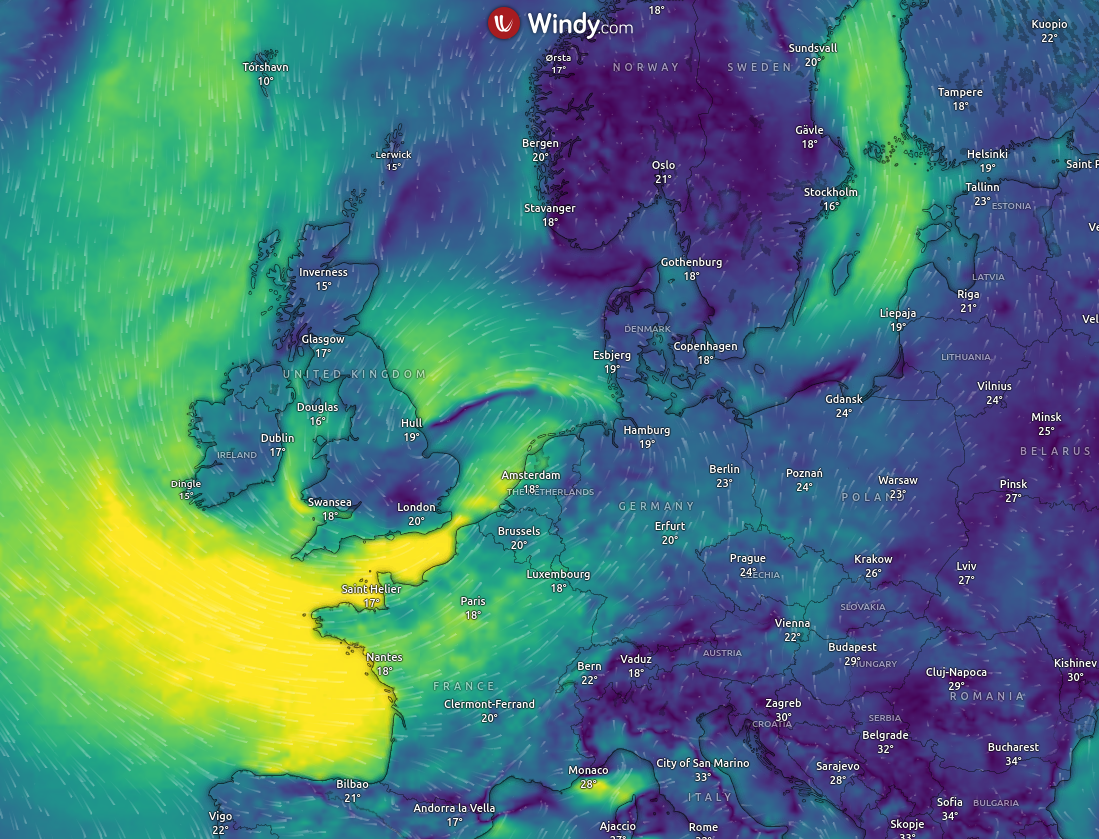
The entire script is available here, and the final result should look like below. If you want the .txt file, it can also be found here.
2023
Back to top ↑2021
Advanced Scientific Matplotlib - Part 1/n
This series of blog post is here to give some of the tricks I use to produce high-quality figures, suitable for publications.
2020
Compact Schemes for the Poisson Equation
If you prefer to follow in the notebook directly, you can also get the notebook.
APS-Division of Fluid Dynamics
Abstract and video of my talk at APS-DFD 2020
My First Post
Trying all that markdown has to offers